Performance Data Points Guiding Line Shifts in Mid-Level Global Card Events
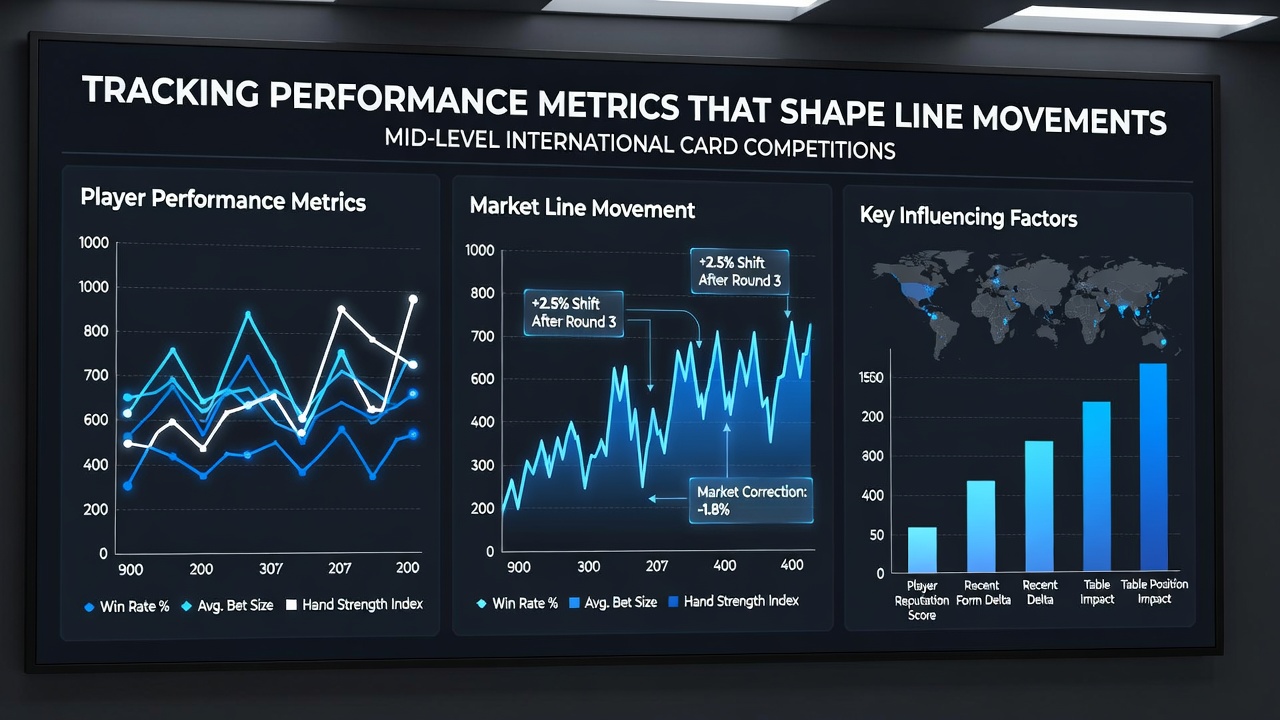
Analysts track multiple performance indicators to explain how betting lines adjust during mid-level international card competitions held across Europe, Asia, and the Americas. These events draw participants from regional circuits where data from past results, table dynamics, and aggregate statistics feed directly into odds compilation processes used by sportsbooks. Observers note that line movements often accelerate when specific metrics reach thresholds that signal shifts in expected outcomes.
Key Metrics Monitored by Odds Compilers
Compilers review historical return on investment figures, heads-up win percentages, and average stack survival rates from similar tournament structures. Data indicates these elements combine with current field composition details to produce initial lines, after which real-time updates occur as play progresses. Research from the International Gaming Institute shows correlations between recent form streaks and subsequent line tightening in events with buy-ins between 5,000 and 25,000 dollars.
Additional variables include average big blinds per hand duration, frequency of all-in confrontations at final tables, and payout structure impacts on risk tolerance. Those who've examined tournament databases find that players maintaining consistent chip accumulation rates over multiple events tend to attract heavier action, prompting sportsbooks to move lines accordingly. Metrics such as final table appearance counts within the prior twelve months also factor into pre-event adjustments.
Regional Variations in Data Application
European circuits emphasize volume-based statistics drawn from multi-day festivals, whereas Asian mid-level events incorporate travel-adjusted performance records more frequently. Figures from Australian regulatory bodies reveal that line volatility increases when participants cross borders for consecutive tournaments without adequate rest intervals. In North American settings, compilers integrate satellite qualifier data to refine starting odds before cards are dealt.
June 2026 schedules include several mid-tier stops where these tracking methods will face fresh tests amid expanded fields. Line adjustments typically begin hours before play starts and continue through early rounds as elimination patterns emerge. Studies compiled by the European Betting and Gaming Association demonstrate that metrics tied to position-specific play produce the most reliable signals for mid-stage movements.
Real-Time Tracking Tools and Their Influence
Software platforms aggregate live chip counts, hand histories, and elimination timestamps to generate alerts when thresholds are crossed. Sportsbooks receive these feeds through established data partnerships that allow rapid responses to developing situations. One documented case involved a player whose late-position aggression metric exceeded prior benchmarks, resulting in a line shift of several points within a single level of play.
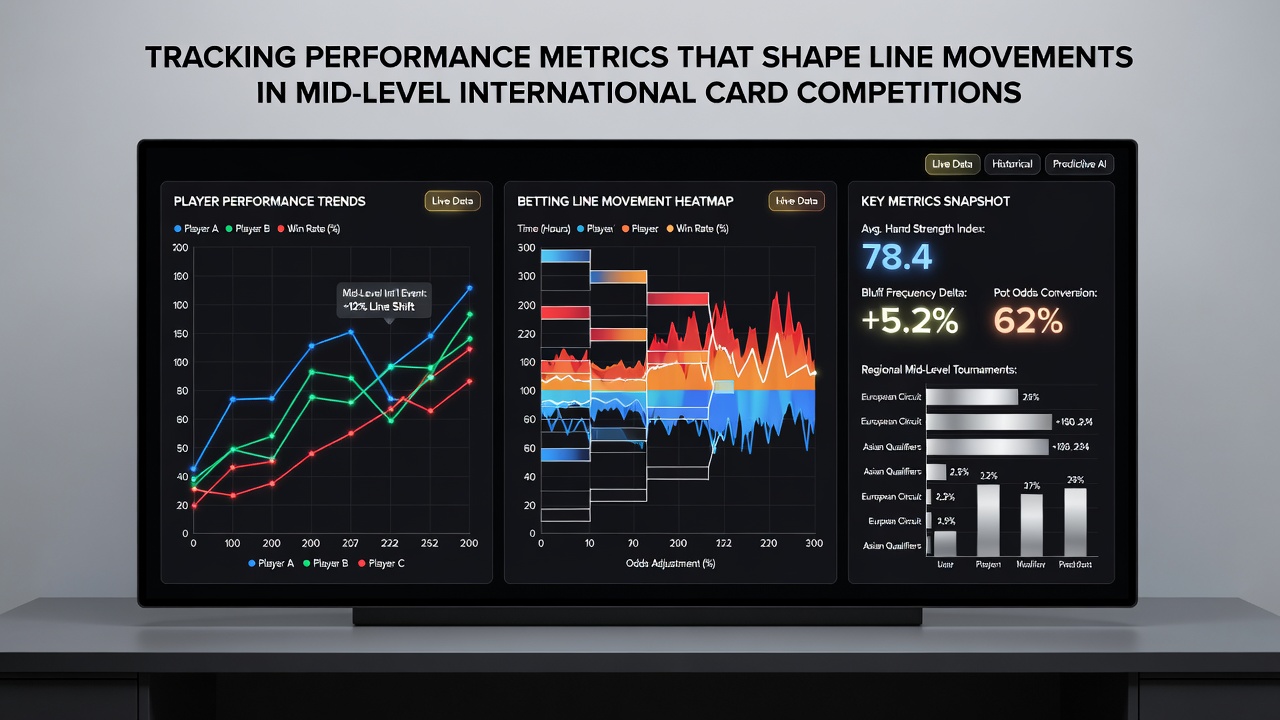
Compilers cross-reference these signals against historical databases to distinguish temporary fluctuations from sustained trends. Metrics covering average fold frequency to three-bet situations and continuation bet success rates receive particular attention during middle stages. Data shows that when such figures deviate markedly from established norms, line movement accelerates in the direction indicated by the outlier.
Impact on Market Liquidity and Participant Behavior
Market depth at these competitions often depends on the clarity of available performance data. When metrics align across multiple sources, bettors place wagers with greater confidence, increasing overall volume. Conversely, sparse data from newer participants can limit liquidity until additional hands provide clearer pictures. Observers note that international fields introduce variables such as language barriers and unfamiliar playing styles that complicate metric interpretation.
Line movements also reflect adjustments for known tendencies among repeat entrants. Those tracking long-term databases identify patterns where certain players consistently outperform expectations in specific formats, leading to proactive line corrections. Research indicates these corrections occur most frequently during the transition from registration to the first break.
Conclusion
Performance metrics serve as foundational inputs for line management across mid-level international card competitions. Compilers combine historical records, live updates, and regional adjustments to maintain accurate odds throughout each event. As June 2026 approaches, continued refinement of these tracking systems will determine how efficiently sportsbooks respond to evolving tournament conditions worldwide. Data integration remains central to the process that connects player statistics with market pricing.